We question the theory that upfront cost alone determines value in generator ownership. We examine total cost of ownership—fixed and variable costs, depreciation, taxes, downtime, and end-of-life disposal—against output hours and duty cycles. We’ll quantify fuel, maintenance, insurance, warranties, and reliability guarantees, then normalize by energy delivered. If you want a robust decision framework, consider scenario and sensitivity analyses that reveal real-world risk and opportunity. The next step shows how to apply this to budgeting and vendor choice.
Key Takeaways
- TCO for generators includes upfront purchase, installation, operating, maintenance, fuel, and end-of-life costs over the asset’s life.
- Model duty cycle, load factors, and fuel price volatility to estimate ongoing cost per hour and lifetime savings.
- Separate cost components into upfront, fixed, and variable for clear budgeting and option ranking via NPV.
- Factor downtime, reliability, warranties, and decommissioning into risk-adjusted cash flows and depreciation.
- Use scenario/sensitivity analyses to compare configurations, fuel types, and replacement timing for optimal decisions.
What Total Cost of Ownership Means for Generators
Total cost of ownership (TCO) for generators encompasses all expenses from purchase to retirement. We quantify TCO by identifying cost components across acquisition, installation, operation, maintenance, fuel, and end-of-life disposal. We assign unit costs, maintenance intervals, and replacement cycles to each component, then sum them to reveal annualized and total values. We also model residual value and downtime losses to reflect real-world productivity impacts. A disciplined risk assessment highlights price volatility, warranty gaps, and failure modes that escalate expenditures. By comparing scenarios, we determine sensitivity to maintenance timing and parts availability. Our approach delivers a transparent, data-driven TCO profile that supports procurement decisions, budget planning, and lifecycle optimization, ensuring stakeholders understand where money goes and how to control long-term generator costs.
How Fuel Efficiency Drives Ongoing Expenses
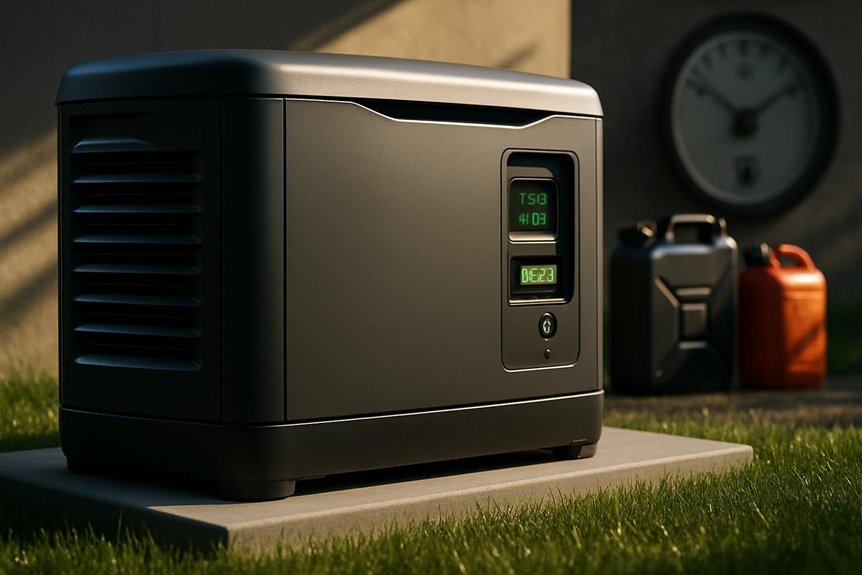
Fuel efficiency is a primary driver of ongoing generator expenses because fuel costs occur continuously during operation. We quantify this impact by evaluating fuel economy at rated loads, including part-load behavior, and translating it into cost per hour. Lower specific fuel consumption (SFC) directly reduces fuel costs, while higher SFC at ambient operating ranges increases expenditure. We compare multiple configurations—engine, generator set, and fuel type—to identify the best balance between efficiency and reliability. Our analysis accounts for duty cycle, load factor, and fuel price volatility, converting efficiency metrics into annualized operating costs. We emphasize that marginal gains in fuel economy yield disproportionate savings over lifetime operation, especially in continuous or high-load applications. Precision modeling supports budgeting and total cost-of-ownership decisions.
Maintenance, Service Intervals, and Downtime Costs
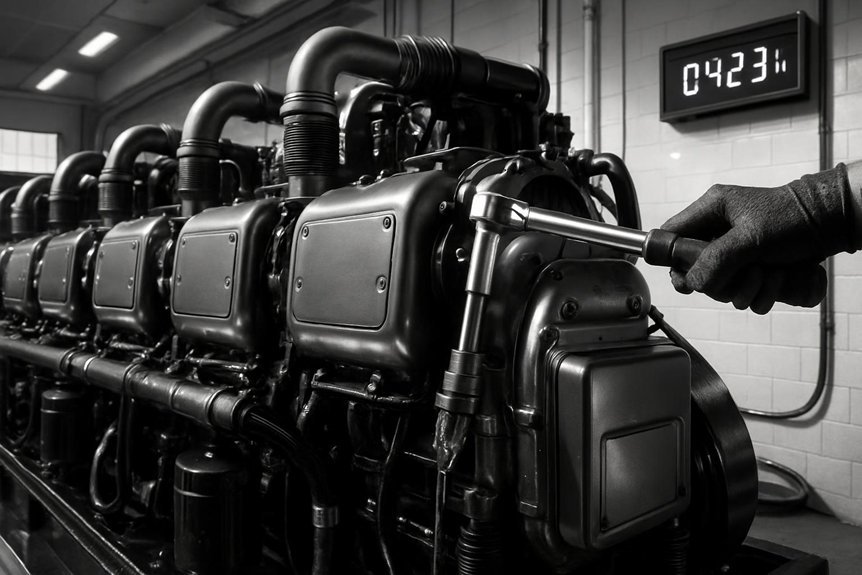
How often will maintenance matter most in total cost of ownership? We quantify maintenance, service intervals, and downtime costs to illuminate total value. We model fixed versus variable maintenance events, cycles per year, and part replacement rates, translating them into dollars per hour of downtime. Our approach ties service intervals to reliability, balancing preventive checks against unplanned failures. We quantify labor rates, parts costs, and utilization, delivering a clear maintenance budgeting framework that highlights threshold intervals where costs spike. Downtime costs, including production loss and restart penalties, dominate when intervals drift beyond optimal. We present a concise schedule-driven cost curve, showing how tighter intervals reduce failure risk but raise routine spend. The result: actionable intervals, precise budgeting, and minimized downtime impacts.
Insurance, Warranties, and Reliability Guarantees
From maintenance-driven cost models, we pivot to how insurance, warranties, and reliability guarantees interact with total cost of ownership. We quantify risk transfer and cost-to-cover impacts as a function of failure rate, MTBF, and downtime penalties. Insurance requirements shape premium exposure, with deductibles influencing cash flow during outages and repair cycles. Warranty coverage, typically extending MTBF-aligned periods, reduces out-of-pocket repair costs but may constrain service scope and replacement timing. Reliability guarantees formalize performance allowances, enabling penalties or credits that offset downtime expenses. We compare total cost implications by scenario: no-coverage baseline, partial coverage, and full coverage aligned with OEM stipulations. Expect lower effective maintenance expense under comprehensive warranty coverage, but higher upfront and annualized insurance costs. Decision makers should model integration points, coverage caps, and claim processes to optimize lifetime cost.
Sizing, Deployment, and Scheduling for Uptime
Sizing, deployment, and scheduling for uptime require a disciplined, quantitative approach that links capacity, availability targets, and downtime penalties. We present a framework you can apply directly: determine required generator capacity from load profiles, tolerate allowable outages with target MTBF, and map penalties to downtime costs. Sizing accuracy matters: small errors ripple into oversizing waste or undersizing risk, so we validate through sensitivity analyses across peak and shoulder loads, considering fuel and maintenance margins. Deployment speed matters too; rapid, repeatable provisioning reduces initial downtime and accelerates recovery. Schedule around maintenance windows, test events, and fuel logistics, using automated checklists to confirm performance before live operation. Our guidance emphasizes traceable metrics, linear-cost implications, and disciplined iteration toward optimal uptime.
End-of-Life Considerations and Resale Value
We summarize end-of-life costs, resale drivers, and depreciation timelines to frame total cost of ownership. We quantify disposal, recycling, and service-life write-offs, and map resale value relative to hours, age, and maintenance history. This gives a baseline for planning upgrades, scrapping, or resale as a function of use and market dynamics.
End-of-Life Costs
How do end-of-life costs shape total ownership? We quantify this phase to minimize surprises. End-of-life planning affects total cost through disposal fees, environmental compliance, decommissioning labor, and potential salvage proceeds. We model net outlay as initial purchase minus expected resale value plus decommissioning and disposal costs, adjusted for inflation and salvage multipliers. Our focus is on predictable cash flows: certified recycling, hazardous material handling, and warranty-voiding steps that influence residual value. We translate risk into a per-year amortization, enabling apples-to-apples comparisons across models and lifespans. End of life, resale value, and compliance costs drive the final TCO, not just upfront price. Aligning maintenance with decommissioning readiness reduces spikes in cash flow and preserves salvage potential.
- End-of-life regulatory costs and fees
- Decommissioning labor and site restoration
- Salvage value vs. disposal penalties
- Timing and discounting of remaining resale potential
Resale Value Drivers
Resale value in end-of-life scenarios hinges on how well a unit remains marketable after its useful life ends. We quantify resale drivers to guide decisions: resale depreciation curves, remaining useful life, and brand/model consistency. We compare scenarios by hours, maintenance, and upgrade potential to forecast value preservation. Our assessment targets post-use marketability and monitorable indicators that affect price bands.
| Factor | Measurable Impact |
|---|---|
| Hours/age | Affects depreciation rate and buyer confidence |
| Maintenance history | Elevates value preservation through documented care |
| Condition/Upgrades | Marketability effect (0–100) |
| Recent repairs, firmware, warranties | Higher resale value, tighter offer ranges |
Depreciation Timeline
Depreciation timelines map end-of-life value trajectories by quantifying how usage, age, and upkeep compress resale potential over time. We quantify a depreciation schedule across lifecycle stages, linking remaining useful life to expected wholesale value. We assess tax implications alongside market demand, ensuring the model reflects both accounting and cashflow realities. Our approach isolates key drivers—hourly wear, maintenance quality, and component obsolescence—that shift resale price curves and salvage options. We project multiple scenarios to bound risk, emphasizing transparent inputs and traceable assumptions. Decisions hinge on time-to-market, remaining efficiency, and regulatory changes that alter residual value. Clear documentation ensures stakeholders understand value erosion paths and tax outcomes through each interval.
- Depreciation schedule sensitivity to utilization and maintenance quality
- Tax implications across lifecycle stages and sale timing
- Residual value thresholds by engine hours and parity with replacement
- Scenario-based projections for end-of-life disposition
A Practical Framework to Compare Options and Plan Budget
We present a practical framework to compare options and plan budgets by outlining Cost Breakdown Methods and budgeting for options in a clear, quantitative way. We’ll quantify upfront, operational, and lifecycle costs, assign confidence intervals, and normalize by output hours to enable apples-to-apples comparisons. This structure lets us prioritize options with favorable total cost of ownership while preserving reliability and schedule flexibility.
Cost Breakdown Methods
Cost breakdown methods enable apples-to-apples comparisons of generator options by segmenting total ownership costs into upfront, fixed, and variable components. We present a practical framework to quantify each segment, enabling repeatable decision criteria. We emphasize transparent accounting, reproducible inputs, and defensible allocations across lifecycle stages. Our focus centers on cost breakdown and how fuel price dynamics reshape total cost of ownership under varying duty cycles and load profiles. We structure the analysis to isolate purchase price, installation, maintenance, and replacement risk, then map operating margins to fuel consumption, emission controls, and utilization rate. This approach supports sensitivity studies and scenario planning, facilitating disciplined option ranking.
- upfront cost and capital recovery
- fixed costs: insurance, permits, and depreciation
- variable costs: fuel, consumables, and maintenance
- scenario and sensitivity analyses
Budgeting For Options
What framework yields the clearest budgeting for options, and how can we apply it to compare alternatives and plan our capital and operating budgets? We present a practical, quantitative method: option-centric budgeting using discounted cash flow, net present value, and real options lift. We model each alternative as a project with capital cost, operating cost, maintenance, and decommissioning, then compute lifecycle costs and breakeven timing. We rank options by total cost of ownership at defined confidence levels, incorporating risk-adjusted discount rates. We document funding strategies for each pathway, mapping capital sourcing to risk tolerance and liquidity. Anticipated budget gaps reveal budgeting pitfalls, enabling mitigation through staged investments or contingency reserves. This framework supports transparent tradeoffs, repeatable comparisons, and disciplined cash-flow planning across procurement and operations.
Frequently Asked Questions
How Do Tax Incentives Affect Generator Total Cost Ownership?
We see tax incentives lower total cost by accelerating depreciation effects and providing emissions credits, while generator subsidies, loan terms, and warranty extensions reduce upfront and long-run outlays; shutdown penalties and fuel efficiency also shape net present value.
What Hidden Costs Appear After Purchase in Practice?
We see hidden costs after purchase as unexpected maintenance and fuel variability, increasing total cost. We quantify risk: maintenance swings add 5–15% annualized, fuel variance adds 10–25% of operating expenses, depending on fuel price volatility.
Which Failures Incur the Highest Replacement Risk Costs?
Reliability-risks rise from rapid failure modes; major risks come from starter, cooling, and fuel-system failures, increasing replacement costs. We evaluate generator reliability, failure modes, service contracts, and maintenance scheduling to minimize unpredictable downtime and expenses.
How Does Downtime Impact Service Contract Value?
Downtime slashes service contract value: each hour of downtime degrades perception and contract premiums, reducing client trust and renewal likelihood. We quantify impact as downtime-perceived cost, lowering service value by X% per hour and improving pricing with reliability metrics.
What Maintenance Scheduling Maximizes Resale Value?
We maximize resale value by strict maintenance scheduling: set maintenance intervals at 6–12 months, track hours, and document corrosion prevention measures; proactive tuning reduces wear, while satire aside, reliability boosts perceived value and buyer confidence.
Conclusion
We’ve shown that Total Cost of Ownership for generators blends upfront, operating, and end‑of‑life costs into a single, comparable metric. By normalizing to output hours and modeling duty cycles, fuel price shifts, and reliability guarantees, you can rank options with transparent NPV and cash flow. Some fear complexity, but the framework simplifies it: quantify inputs, run scenarios, and pick the lowest TCO with acceptable risk. In practice, disciplined budgeting beats gut picks every time.