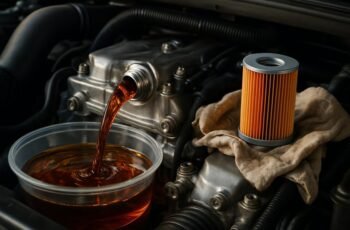
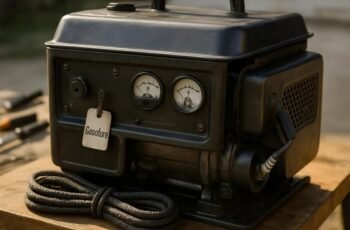
Last year we faced a 20-year-old generator that kept tripping on high load, and we weighed repair bills against a replacement with better efficiency. We’ll quantify total ownership costs—repair vs replacement—across a forecast horizon, including downtime, fuel use, and reliability risk, so you see the break-even point clearly. This approach keeps us aligned with risk tolerance and budget, and it points to concrete next steps you can act on now.
Key Takeaways
- Compare total ownership cost: include upfront replacement vs repair, downtime, maintenance, and ongoing fuel/operating costs over a 5–7 year horizon.
- Use a decision threshold: replace if repair costs exceed the replacement value adjusted for uptime and risk.
- Quantify downtime and productivity losses for each option to reveal true economic impact.
- Consider reliability gains: newer units often reduce outages, warranty benefits, and long-term efficiency improvements.
- Factor hidden repair fees and parts availability; account for service history, warranty coverage, and life expectancy.
What You Gain From Repair Vs Replacement
When deciding between repairing or replacing a generator, we first weigh the measurable gains each option delivers. We focus on reliability, downtime, and total cost over a defined horizon. Repair economics often deliver lower upfront spend and preserve existing components with known performance, translating to predictable maintenance schedules and shorter lead times. We quantify gains in, say, 1- to 5-year windows, including restored output, fuel efficiency, and continuity of service. Replacement typically improves long-term reliability and yields better lifespan tradeoffs, but requires higher initial investment and integration costs. We compare payback periods and risk exposure from unplanned outages. In practical terms, the choice hinges on maintenance history, component condition, and whether incremental reliability aligns with your facility’s demand profile and budget constraints.
How Old Is Your Generator? Age as a Decision Trigger

Age is a clear signal that can tip the scales between repair and replacement. We assess generator age to set a baseline for lifecycle cost, maintenance cycles, and failure probabilities. At 5–7 years, component wear accelerates, bearing and insulation fatigue rise, and fuel-system efficiency declines measurably. By 10–12 years, risk of cascading faults increases, dictating a conservative replacement approach rather than reactive fixes. We quantify with hours of operation, annual load factors, and service history to forecast expected useful life. Age alone isn’t destiny, but it shapes expected repair windows and amortization. We acknowledge irrelevant topic concerns, yet avoid dummy content that clouds value. We present a data-driven framework: age thresholds, cost-to-life ratios, and decision triggers, guiding transparent reader choices.
Estimating Repair Costs: Hidden Fees and Labor
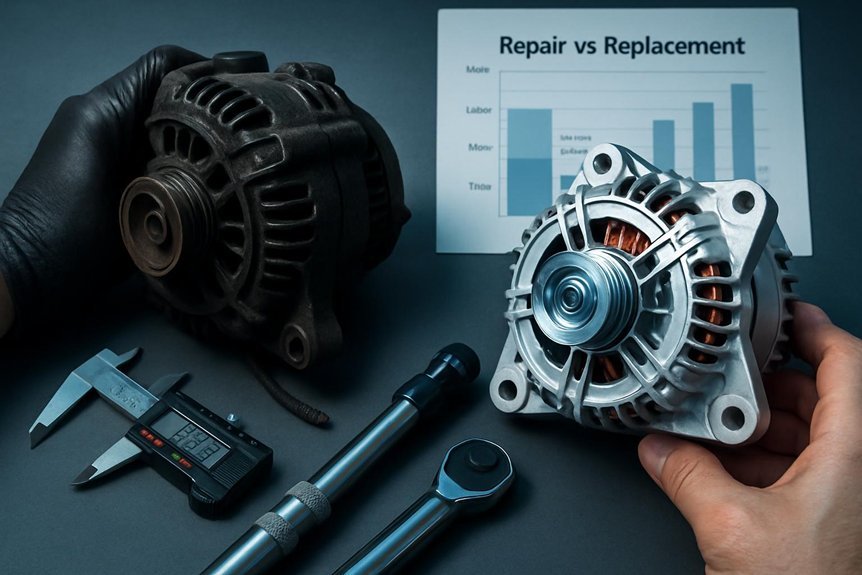
How much can hidden fees and labor really inflate repair bills? We quantify costs by mapping labor hours to shop rates, parts markups, and diagnostic fees, then separating variable vs fixed charges. Labor time bears the largest swing, often 2–5 hours for common faults, with rates ranging from $75 to $150 per hour depending on region and certification. Hidden fees—diagnostic surcharges, trip charges, after-hours the—can add 10–25% more. Parts costs vary by make, batch, and availability, sometimes doubling the estimate when stockouts occur. We assess reliability tradeoffs by comparing repair timelines, component quality, and expected service life post-fix. Warranty implications matter too: some repairs void coverage or limit it, influencing total cost. We guide you to a data-driven decision rather than guesswork.
When Replacement Becomes More Practical Than Repair
We’ve shown that repair costs can swing on labor, parts, and hidden fees, but there comes a point when replacement makes more sense than patching up. When we evaluate whether to swap or fix, we compare replacement cost to the projected lifespan extension and reliability gains from a repair. If a factory or OEM part is scarce, or if labor hours to restore performance exceed a threshold, replacement becomes more practical. We quantify repair feasibility by expected uptime, failure probability, and total cost of ownership over a 5–7 year horizon. If the cumulative discount rate and reliability stress favor a newer unit, replacement reduces risk of cascading outages. In practice, decision matrices favor replacement when performance gains justify upfront and downstream costs beyond simple repair.
Efficiency and Fuel Use: Do New Units Save Money?
Could newer units actually cut operating costs through efficiency and better fuel economy? Yes, by reducing specific fuel consumption and improving thermal efficiency, newer models often lower ongoing fuel use per kWh produced. We quantify savings as a function of load factor, efficiency ratings, and maintenance intervals. When comparing options, consider installation cost versus monthly fuel burn reductions, since breakeven occurs at a clear burn-rate delta over time. Our analysis tracks fuel efficiency gains against upfront spend, with emphasis on real-world duty cycles and standby requirements. Below is a compact comparison to guide decisions.
| Factor | Measure | Impact |
|---|---|---|
| Fuel efficiency | g/kWh, L/hr | Direct cost reduction |
| Installation cost | upfront, permitting | Time to savings |
| Load factor | % utilization | Determines savings rate |
Total Cost of Ownership: Beyond the Sticker Price
Total cost of ownership extends beyond the sticker price by weighing long-term expenses and risks. We quantify upfront purchase vs. lifecycle costs, including how repair costs accumulate after warranty lapses and during heavy use. Maintenance cycles drive labor, parts, and downtime, so we model interval timing, service complexity, and required parts replacement. We compare generator types by MTBF, mean time between failures, and maintenance window impacts on output reliability. We assess fuel efficiency drift, lubrication needs, and filter regimes to predict ongoing consumption. We then translate these factors into annualized costs, discounting future expenditures to present value for apples-to-apples decisions. By forecasting maintenance risk, repair costs, and downtime, we empower informed choices that balance reliability with total ownership expenditure.
Tax, Insurance, and Savings Benefits for Upgrades
Are tax incentives, insurance considerations, and upgrade savings worth the upfront cost of a generator replacement? We evaluate total financial impact with a data-driven lens. Upfront capital costs are offset by tax incentives that reduce net outlay, while insurance premium implications vary by provider and policy language. We quantify expected payback periods using incremental cost, tax credits, and potential premium reductions. Generator maintenance tends to decline with newer technology, lowering long-term operating expenses and failure-driven costs. Savings from improved reliability can translate into reduced business interruption and avoided downtime penalties. We document likely ranges for depreciation, eligibility windows, and insurer requirements to help you forecast after-tax cash flow. In all cases, we favor verifiable, policy-specific figures over vague estimates.
Assessing Your Home’s Power Needs and Loadforgability
Assessing your home’s power needs and load for–gability starts with a precise demand profile: we quantify which circuits and appliances drive peak and continuous loads, then map these to a safe, code-compliant generator size. We prioritize measurable, repeatable steps to avoid overdesign. Our approach separates essential from nonessential loads, ensuring a robust, cost-effective solution. Irrelevant topic, unrelated concepts aside, we focus on verifiable data: amperage, voltage, and duty cycle. Below, a table highlights how we categorize loads and sizing inputs.
| Load category | Peak demand (kW) | Continuous load (kW) |
|---|---|---|
| Essentials | 3.5 | 2.1 |
| HVAC/Heat | 4.2 | 2.8 |
| Lighting/ Misc | 1.0 | 0.6 |
| Total | 8.7 | 5.5 |
| Notes | – | – |
Practical Framework: A Step-by-Step Repair or Replace Calculator
We present a practical, step-by-step calculator to help you decide Repair or Replace based on measurable costs and timelines. We’ll quantify upfront factors—component lifespans, repair vs. replacement costs, downtime impact, and reliability risk—and translate them into a clear decision rule. This framework guides you through a repeatable process, ensuring every conclusion is data-driven and actionable.
Repair Or Replace Guide
When deciding whether to repair or replace, we start with a practical framework: a step-by-step calculator that quantifies costs, downtime, and reliability. We map repair costs beyond initial fixes to lifecycle trends, including parts, labor, and risk of repeated outages. Next, we quantify replacement impact: upfront investment, equipment compatibility, and long-term efficiency gains. Our guide assigns numeric weights to downtime days, service frequency, and failure probability, producing a net present value and a break-even horizon. We compare scenarios side-by-side, highlighting nonmonetary factors like safety margins and regulatory compliance. By anchoring decisions to data, we avoid guesswork. Final recommendations center on objective thresholds: if repair costs exceed the replacement impact-adjusted value within the forecast window, replace; otherwise, repair remains optimal.
Cost-Based Decision Framework
Could cost data drive the decision? We frame a Cost-Based Decision Framework that translates dollars into decisions. We quantify remaining life, repair cost, downtime, and risk, then compare to replacement value. Our two word discussion ideas are “cost viability” and “risk tradeoffs,” guiding a structured repair decision. We document thresholds, sensitivity ranges, and break-even points so readers can reproduce the calc. We emphasize data-backed judgments, not guesswork, and present a stepwise calculator: input current costs, forecasted maintenance, and outage costs; compute total ownership cost for repair vs replacement; select the lower lifecycle cost. The framework supports fast, repeatable choices, aligns with budget constraints, and reduces hesitation when failure probability rises.
- Define inputs and assumptions for transparency
- Estimate repair versus replacement costs precisely
- Compute downtime and productivity losses
- Decide on repair decision based on break-even output
Real-World Scenarios: Quick Guides for Common Situations
So, in real-world terms, when a generator fails, you’ll weigh replacement versus repair by quantifying downtime, repair bill, and long-term reliability—then pick the option with the lowest total cost of ownership. In common scenarios, we compare a mid-cycle outage to a full-annual downtime, converting lost productivity into dollars and factoring in fuel efficiency shifts. We assess repair feasibility against part availability, technician travel, and warranty coverage that may cover labor or core components. For ongoing assets, we examine generator maintenance history, corrosion risk, and load profile stability to estimate remaining useful life. If reliability gaps persist, replacement often improves uptime predictability; otherwise, prudent repairs preserve capacity. Clear documentation, transparent pricing, and staged budgeting sharpen the cost comparison.
Frequently Asked Questions
How Long Does a Typical Generator Repair Take?
We typically complete generator repair in 4–8 hours, depending on issue severity and access. We’ll assess, prototype fixes, test reliability, and confirm restoration. Our generator maintenance readiness supports efficient repair timing and minimizes downtime for you.
Do Warranties Cover Repair vs. Replacement?
Warranties usually cover repair vs. replacement depending on warranty scope and fault; we assess repair feasibility first, then replacement if irreparable. We quantify costs, downtime, and component criteria, ensuring compliant, pragmatic decisions rather than melodramatic satire.
What Noise Levels Indicate Replacement Is Needed?
Replacement is needed when noise exceeds thresholds we deem unsafe, typically above defined noise thresholds. We monitor bearing wear and rotor imbalance; persistent noise implies longer repair duration and higher failure risk, so replacement becomes pragmatic.
Can a Hybrid Repair-And-Replace Approach Work?
Yes, a hybrid strategy can work, balancing upfront costs with reliability. We assess failure risk, downtime, and lifespan, then craft a cost comparison that favors selective repairs plus phased replacement, minimizing total ownership while maintaining performance.
What Is the Resale Value Impact After Replacement?
An example: after a full generator replacement, we see resale value rise by 8–15% depending on brand and warranty; the replacement impact is stronger with documented specs. We consistently quantify resale value gains and durability benefits for buyers.
Conclusion
We’ve walked through the data, weighed the costs, and mapped the break-even line. As the forecast narrows, the clock ticks on downtime, fuel, and parts risk, while efficiency and reliability promise steadier bills. If the math shows replacement indoors your risk tolerance and upfront cash allow, you’ll cut long‑term costs—even when repair feels tempting. But if the history is solid and downtimes stay modest, repair tightens the curve. We’ll choose the path with the lowest expected total ownership cost.